
INWP Lender Spotlight: November 2026
Northern Ontario Housing & Mortgage Monthly
For clients in North Bay, Greater Sudbury, Muskoka, Sault Ste. Marie & Timmins — November 2026

Executive Summary - November 2026
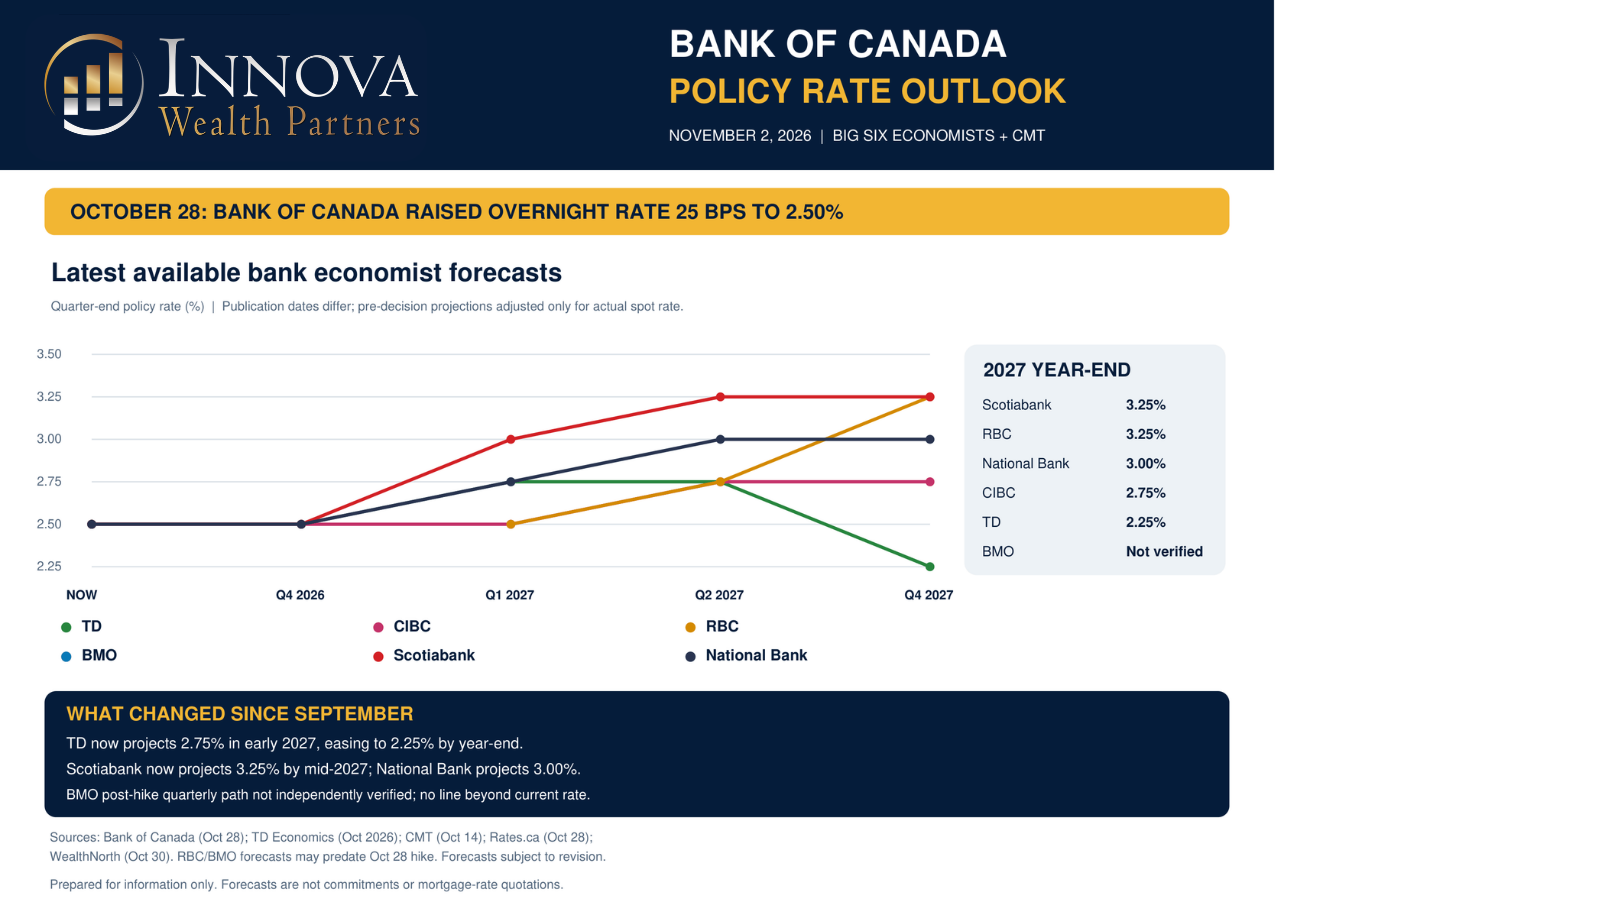
October answered the question we raised in our last report: the Bank of Canada did follow the U.S. Federal Reserve with a rate increase. On October 28, the Bank raised its overnight rate by 25 basis points to 2.50%. The important point is not just the quarter-point increase. It is the Bank’s acknowledgement that inflation may stay higher for longer, even while the Canadian economy remains vulnerable to tariffs and a softer labour market.
Northern Ontario housing is not moving in lockstep. September sales declined in Sudbury, Sault Ste. Marie and the Timmins–Cochrane–Timiskaming district, while North Bay and Thunder Bay reported stronger activity. Timmins-area prices and tight inventory also stand out against softer benchmark prices in several other Northern markets. Local supply and property quality matter more than regional generalizations. Muskoka adds a different picture: waterfront and non-waterfront properties have distinct pricing and inventory dynamics, making regional averages especially misleading.
Market Snapshot
Bank of Canada overnight rate: 2.50% (October 28 decision; previously 2.25%).
Canadian headline CPI: 3.1% year over year in September (up from 3.0% in August).
CPI excluding gasoline: 2.2% year over year in September.
Next Canadian CPI release: November 16, 2026. Next Bank of Canada rate decision: December 9, 2026.
Interest Rate Outlook
The Bank of Canada Raised Rates. What Happens Next?
The Bank of Canada increased its overnight target to 2.50% on October 28, citing the risk that persistently high energy costs will spread more broadly through the economy. Its October projections now put inflation around 3.5% by the end of 2026, averaging approximately 3% in 2027 before returning to 2% around mid-2028. The Bank explicitly left open the possibility of further increases, while emphasizing that it would proceed carefully.
This is a meaningful shift from the prolonged hold at 2.25%. The Bank is responding to more persistent inflation rather than an overheating domestic labour market. In its October statement, it estimated Canadian growth of 1% in 2026 and 2% in both 2027 and 2028. The unemployment rate has hovered around 6.5%, and trade-related risks remain significant.
September CPI helps explain the decision. Headline inflation rose to 3.1%, with gasoline prices up 27.8% year over year. Transportation inflation was 8.4%, but inflation excluding gasoline was only 2.2%. The distinction matters: a broad inflation problem would call for a different policy response than a concentrated energy shock. The Bank is worried about the former developing from the latter.
Two Dates to Watch
November 16 — October CPI. The key question is whether energy-related costs are feeding into a wider range of goods and services.
December 9 — Bank of Canada decision. Another increase is possible, but it is not a foregone conclusion. Incoming inflation, employment and growth data will matter.
Fixed versus Variable Mortgages
The October overnight-rate increase directly changes the economics of many variable-rate mortgages and lines of credit, subject to each lender’s prime-rate and product terms. Fixed mortgage pricing can move before or without a Bank of Canada decision because lenders also price against bond-market yields and funding spreads.
For clients uncomfortable committing fully to one rate scenario, a split fixed/variable structure can be worth evaluating where available. The objective is not to predict the exact next move, but to balance payment certainty against flexibility. Compare the total cost, prepayment privileges, penalties and renewal timing before choosing a structure.
NORTHERN ONTARIO REAL ESTATE — SEPTEMBER 2026
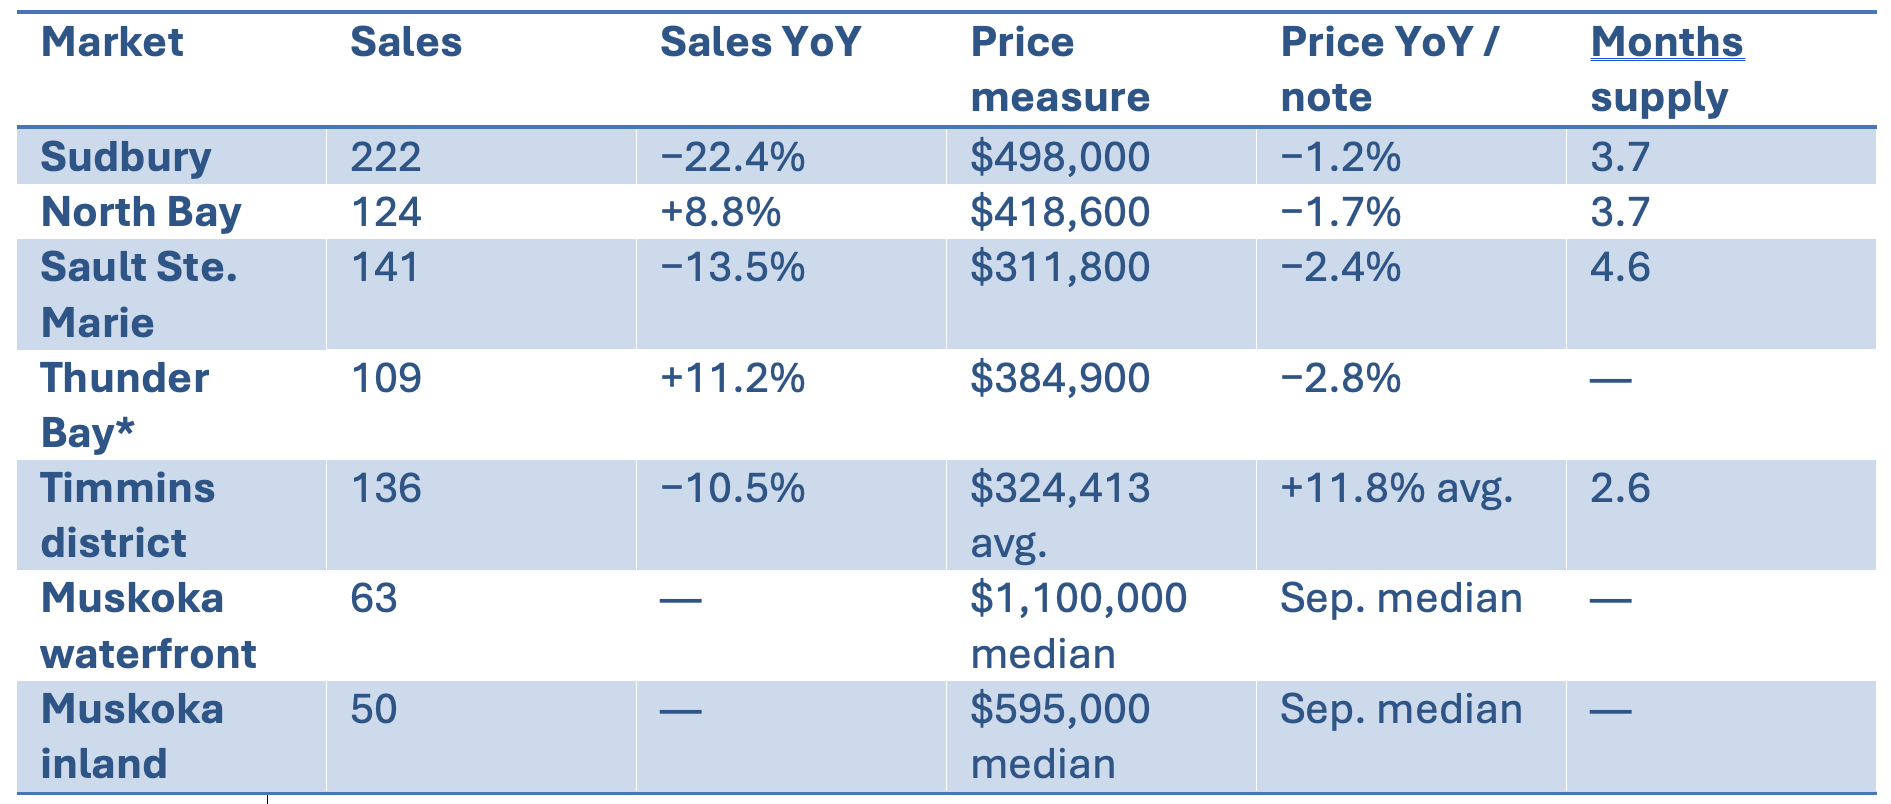
The most recent published board-level figures available for this November edition cover September. Sales comparisons below are year over year; Thunder Bay sales refer specifically to single-detached homes in the city, whereas its benchmark is the board’s overall composite benchmark. Muskoka figures below use September detached-home sales and medians, separately for waterfront and non-waterfront, rather than MLS HPI benchmarks.
* Thunder Bay: city single-detached sales; benchmark is overall composite. Do not compare these as identical housing categories.
North Bay Market Snapshot

North Bay’s September activity was stronger: 124 sales, up 8.8% year over year. Its benchmark price nevertheless declined 1.7% to $418,600. Active listings increased 3.8% to 461, and supply stood at 3.7 months. Stronger transactions do not automatically mean prices are accelerating.
Sudbury Market Snapshot

Sudbury recorded 222 sales in September, down 22.4% from a year earlier. The benchmark price was $498,000, down 1.2%. Active listings rose 10.1% to 826, and months of inventory increased to 3.7 from 2.6 a year ago. Buyers have more choice, and sellers need to be increasingly deliberate about pricing.
Sault Ste. Marie Market Snapshot

Sault Ste. Marie remains the softest of these four markets on several measures. September sales fell 13.5% to 141, and the benchmark declined 2.4% to $311,800. Active listings climbed 19.2% to 647; months of inventory reached 4.6, compared with 3.3 one year earlier. This creates more room for buyers to negotiate, particularly on properties requiring work.
Thunder Bay Market Snapshot

Thunder Bay had 109 city single-detached sales in September, up 11.2% year over year. Its overall composite benchmark was $384,900, down 2.8%. This is a useful reminder that transaction volume and pricing can move in different directions, and that the mix of homes sold matters.
Timmins, Cochrane, & Timiskaming Districts

The district recorded 136 residential sales in September, down 10.5% from a year earlier, but still above both its five- and ten-year September averages. The average sale price rose 11.8% year over year to $324,413; the year-to-date average was $316,318, up 7.5%. Unlike several other Northern markets, active listings declined 18.3% to 353, leaving only 2.6 months of inventory versus a long-run September average of 4.8 months. That points to relatively tight supply even as transactions cool. For investors, the lower entry price is appealing, but financing and repair assumptions still need to be conservative. These figures cover the entire Timmins–Cochrane–Timiskaming board area, not the City of Timmins alone.
Timmins district: board-wide average sale price, NOT an MLS HPI benchmark. The +11.8% change is average-price growth, not benchmark appreciation. Do not directly compare price levels or growth measures with HPI figures for the other markets.
Muskoka - Waterfront and Non-Waterfront

Muskoka’s September market is best understood as two distinct segments. Waterfront detached properties recorded 63 sales at a median sold price of $1,100,000, while non-waterfront detached properties recorded 50 sales at a median of $595,000. Median marketing times were 41 and 27 days, respectively. Waterfront properties sold at a median 93% of final asking price, compared with 96% for non-waterfront properties. These are September transaction medians, not MLS benchmark prices.
The broader year-to-date district picture reinforces the distinction. Through September, waterfront sales totalled 343, down 6.0% year over year, with a $1,200,000 median (+0.8%). There were 465 active waterfront listings at September 30, equivalent to about 13.2 months of supply using a trailing-12-month sales pace. Non-waterfront residential sales totalled 503 year to date, down 8.5%, with a $630,000 median (-3.8%) and approximately 7.5 months of supply. These year-to-date measures are not interchangeable with the monthly figures above.
For buyers, the elevated inventory and below-asking sale ratios suggest room to negotiate, especially on waterfront properties. For sellers, lake, shoreline, access, condition and price tier can matter far more than a district-wide median. Investors should underwrite seasonal occupancy, maintenance and carrying costs rather than treating cottage and year-round rental markets as equivalent.
The Ontario Backdrop
Ontario recorded 13,340 residential sales in September, down 8.3% year over year. The provincial benchmark was $736,300, down 3.9%. Province-wide months of inventory reached 5.4. Northern Ontario remains comparatively affordable, but it is no longer accurate to describe every northern market as experiencing stable or rising benchmark prices.
Rental & Investment Market
For income-producing real estate, higher borrowing costs bring underwriting discipline back to the foreground. Test debt service at the actual available financing rate and a higher renewal rate. Build realistic allowances for property taxes, insurance, utilities, repairs, vacancies and management. Distinguish current in-place net operating income from a stabilized projection, and ensure any rent-growth assumptions are supportable.
In markets with rising resale inventory, sellers may become more flexible. That can create opportunity, but the purchase price needs to compensate for financing risk, capital expenditures and the time required to stabilize the asset. The best investment is not necessarily the property with the largest projected rent increase; it is the one whose economics still work when the assumptions are conservative.
Buyer Takeaway
Use improved selection to negotiate on price, inspections and financing conditions, but do not assume mortgage rates will fall before closing. Secure an appropriate rate hold where available, and compare payment and penalty risk across fixed, variable and split structures.
Investor Takeaway
Underwrite to today’s financing market, not a hoped-for rate cut. For multifamily acquisitions, pay particular attention to the in-place rent roll, actual expenses, near-term capital needs and lender treatment of projected rents. Preserve liquidity for stabilization and refinancing.
Seller Takeaway
Price against recent comparable transactions and current competing listings. September’s price declines and greater inventory in several markets make ambitious initial pricing harder to sustain. Well-presented, accurately priced properties can still transact.
Innova Rate Outlook
Our near-term base case is a cautious Bank of Canada rather than an automatic series of hikes. However, after October’s increase and the Bank’s revised inflation forecasts, borrowers should plan for a wider range of outcomes, including rates remaining elevated or increasing modestly if price pressures broaden. Canada’s softer labour market and trade exposure argue against assuming the Bank will simply replicate the U.S. rate path.
For variable-rate borrowers, revisit payment sensitivity to another 25–50 basis points. For fixed-rate borrowers, monitor live lender pricing and bond-market movements rather than relying only on Bank of Canada announcements. For both, the most durable strategy is a mortgage structure that fits cash flow and preserves reasonable flexibility.
Conclusion
Last month we asked whether the Bank of Canada would follow the Fed. It did. The question for November is whether the October increase is enough to contain inflation without putting unnecessary pressure on growth. The November 16 CPI release and December 9 rate decision will help answer that.
Northern Ontario continues to offer opportunities, but local conditions are diverging. Better negotiating leverage in Sudbury or Sault Ste. Marie should not be confused with identical conditions in North Bay or Thunder Bay. Whether buying a home or underwriting an investment property, make the numbers work at today’s rates and leave room for the unexpected. Muskoka is particularly segment-dependent: cottage-market pricing and liquidity should be assessed separately from in-town residential properties.
Sources
Bank of Canada, October 28, 2026 rate announcement and Monetary Policy Report: https://www.bankofcanada.ca/2026/10/fad-press-release-2026-10-28/
Statistics Canada, September CPI (released October 19): https://www150.statcan.gc.ca/n1/daily-quotidien/261019/dq261019a-eng.htm
CREA local board statistics (September 2026): https://stats.crea.ca/board/sudb/ ; https://stats.crea.ca/board/noba/ ; https://stats.crea.ca/board/saul/ ; https://stats.crea.ca/board/thun/ ; https://stats.crea.ca/board/timm/ Muskoka September detached-home data: https://www.lakecountryrealestateteam.com/blog/september-2026-cottage-country-market-update ; additional district context: https://muskoka-realestate.ca/muskoka-market-update-september-2026/ . CREA OnePoint series currently suspended pending data validation: https://creastats.crea.ca/board/musk/ .
CREA Ontario September 2026: https://stats.crea.ca/board/orea/
Statistics Canada CPI portal (next release): https://www.statcan.gc.ca/en/subjects-start/prices_and_price_indexes/consumer_price_indexes
If you want a personalized renewal, purchase, or investment analysis, just email
Thanks for reading!
Caleb O'Connor, CFP
Partner | Financial Planner | Mortgage & Lending Lead, Innova Wealth Partners
Mortgage Agent Level 1, HomeLink Financial Corp, Brokerage Lic. #10875
📩
This publication is for informational purposes only and shall not be construed to constitute any form of advice. The views expressed are those of the author alone. Opinions expressed are as of the date of this publication and are subject to change without notice and information has been compiled from sources believed to be reliable. This publication has been prepared for general circulation and without regard to the individual financial circumstances and objectives of persons who receive it. You should not act or rely on the information without seeking the advice of the appropriate professional. This report has been prepared by Caleb O'Connor, Financial Planner | Mortgage & Lending Lead, Innova Wealth Partners, for general information and educational purposes only. The information contained in this report is based on sources believed to be reliable; however, accuracy and completeness cannot be guaranteed. Market conditions, interest rates, lender policies, economic data and forecasts are subject to change without notice. The commentary and outlook presented are not intended to constitute individualized financial, investment, tax, legal, accounting or mortgage advice, nor should they be considered a recommendation to buy, sell or finance any particular property or investment. Any forward-looking statements, including expectations regarding interest rates, inflation, economic conditions or real estate markets, are opinions based on information available at the time of publication and actual outcomes may differ materially. Mortgage rates shown are illustrative market indications only and are not a commitment or guarantee of financing. Rates and mortgage terms vary by lender and are subject to borrower qualification, creditworthiness, property type and location, loan-to-value, amortization, insurability and other lender-specific criteria. Mortgage products and services are arranged through the applicable licensed mortgage brokerage. Investment products and services are offered through the appropriately registered dealer and are subject to applicable securities regulation. Insurance products and services are offered through appropriately licensed insurance representatives where applicable. Readers should obtain advice appropriate to their individual circumstances from qualified financial, mortgage, tax, legal and other professional advisors before making financial, investment, borrowing or real estate decisions. Data current to late September 2026 unless otherwise indicated.
- Hits: 35